Home / Reporting and Dashboard
PRODUCT

See your readiness at a glance

Hosted scans and uploaded private-network results land in the same dashboard. One account, one view. Every host you scan, whether Cipherscan reached it automatically or you uploaded results from the private-network CLI, shows the same pass or fail status and rolls into the same overall readiness percentage, with no separate dashboard for either.
62%
READY
Your domains
62% ready overall
web-01.internal
Hosted scan · TLS · ML-KEM-768
ready
bastion-02
Uploaded · TLS · ML-KEM-768
ready
legacy-api.internal
Hosted scan · TLS · RSA-2048
exposed
db-03
Uploaded · TLS · ECDHE-P256
exposed
Hosted and uploaded scans appear together, not as separate sections.
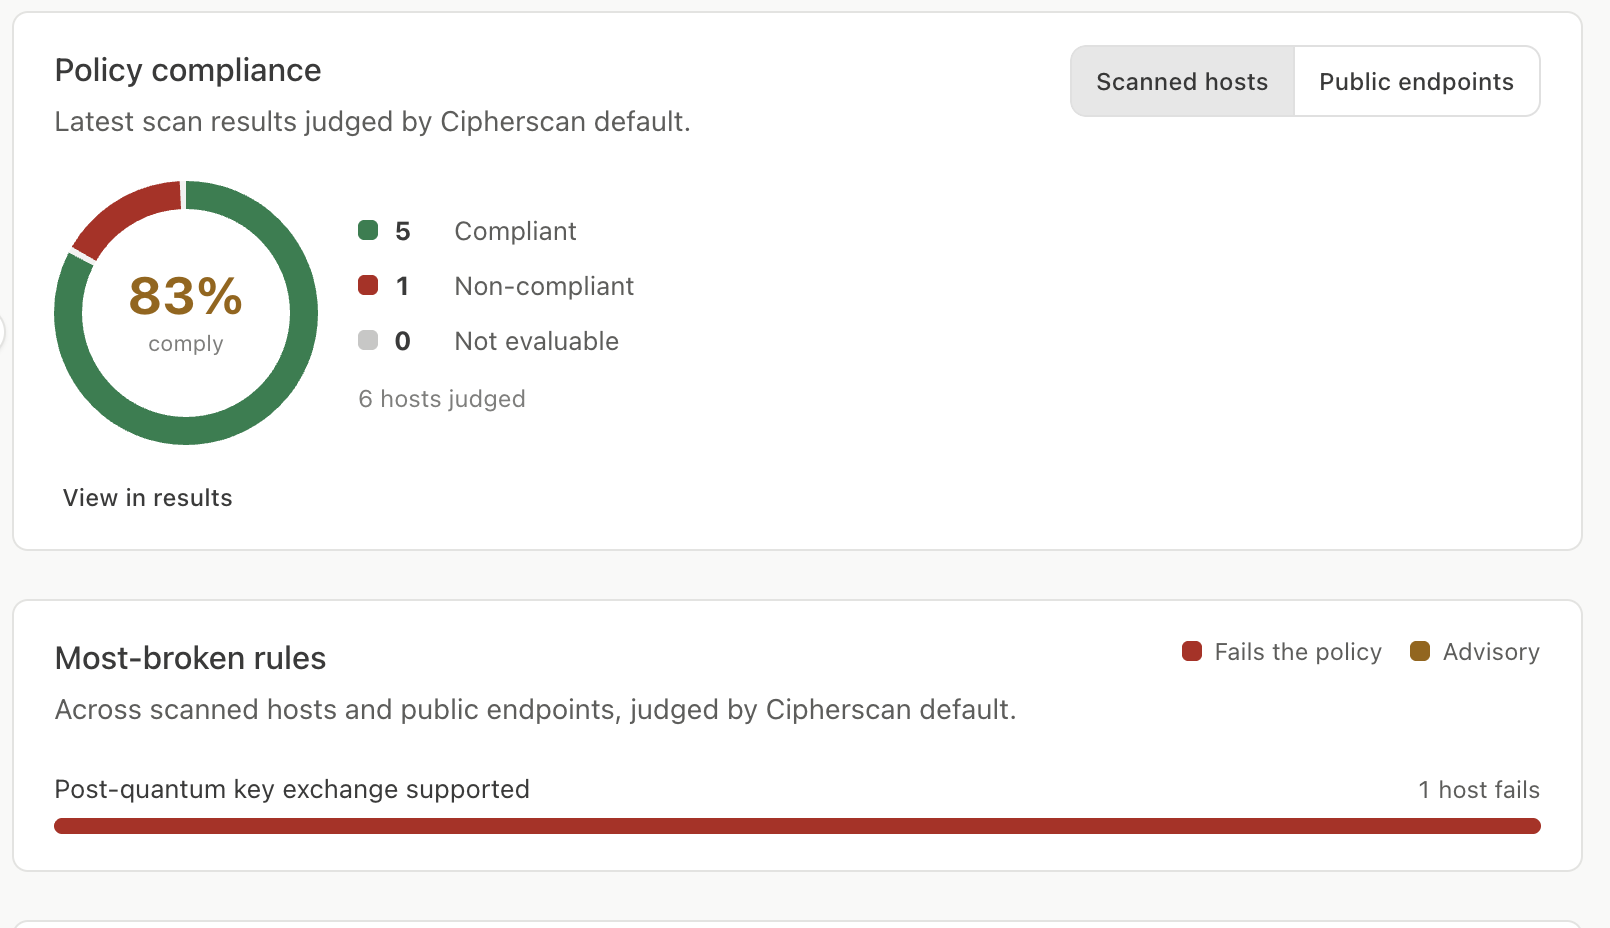
Cipherscan dashboard showing policy compliance donut chart at 83% and most-broken rules list
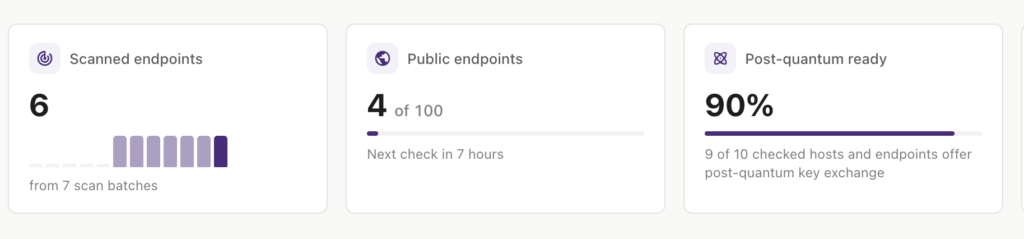
Cipherscan dashboard summary cards showing 6 scanned endpoints, 4 of 100 public endpoints, and 90% post-quantum ready

One account, one view

Every host you scan, whether Cipherscan reached it automatically or you uploaded results from the private-network CLI, shows the same pass or fail status and rolls into the same overall readiness percentage. There’s no separate dashboard for uploaded results, it’s one account.